
An Essential Guide to Dynamically Filtering Your Dashboard
Introduction
In our quest to provide you with the most powerful and intuitive tools for data analysis, we’ve introduced a powerful feature to our dashboard: Filter Views. This functionality allows users to dynamically filter their dashboard widgets, thereby customizing their data view based on specific needs and preferences.
Filter Views allow you to filter individual widgets and apply filters based on their underlying data stream. This means that you can have multiple filters applied to different sets of data, all within the same dashboard. Furthermore, there’s no limit to the number of Filter Views you can have on a dashboard.
In this blog post, we’ll guide you through the steps to add Filter Views to your dashboard and harness their potential for a streamlined data analysis experience.
Step 1: Open the Desired Dashboard
Start by opening the dashboard to which you want to add Filter Views.
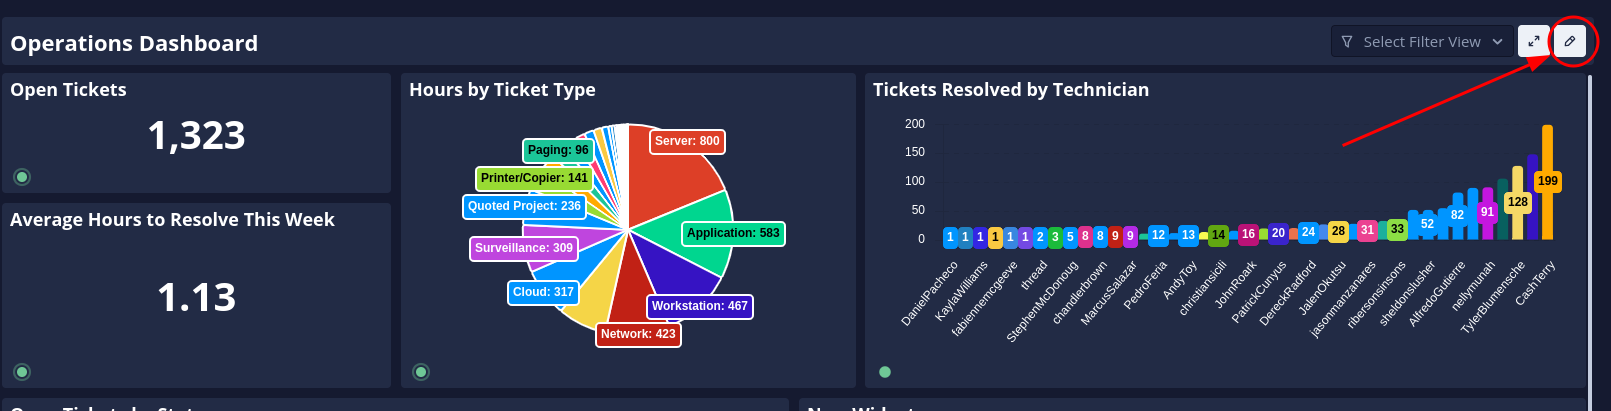
Step 2: Enter Edit Mode
Next, click the edit button located in the top right corner of your dashboard. This will enable you to make modifications to the dashboard.
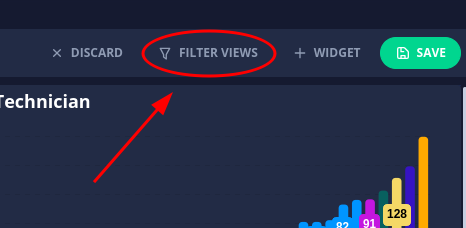
Step 3: Access Filter Views
Now, click on the Filter Views button to open the Filter Views section.
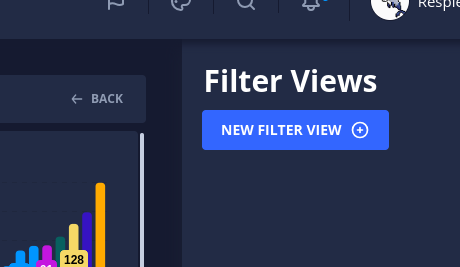
Step 4: Add a New Filter View
In the right side menu, click the “Add Filter View” button.
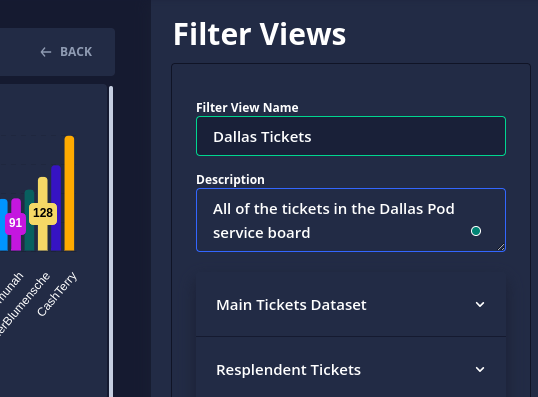
Step 5: Name Your Filter View
Give your new Filter View a name and description. The name should reflect the data you want to show when the filter is selected. For instance, if the Filter View is meant to display data for a specific customer, you could name it after that customer.
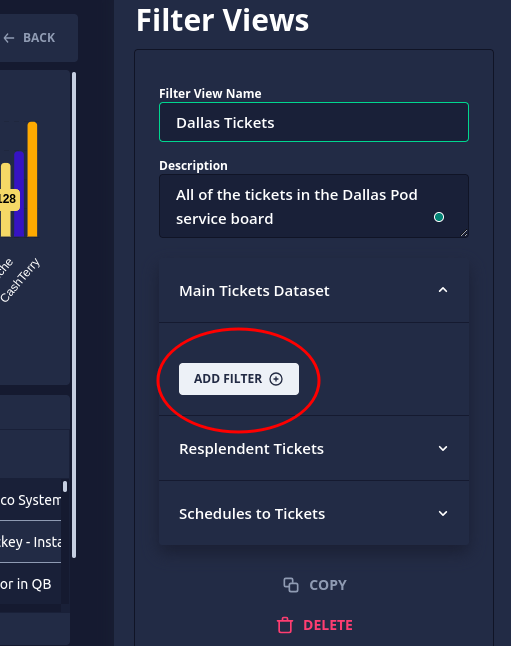
Step 6: Configure Filters
A Filter View allows you to filter specific widgets on the dashboard, so if you only want to filter a subset of widgets, you can. The filters are separated by the data streams on the widgets across the whole dashboard. You can add multiple filters under a data stream. If multiple widgets share the same data stream, you can filter them differently. Let’s start by adding one filter. Click the “Add Filter” button under the first data stream.
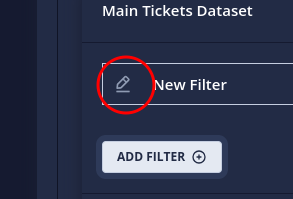
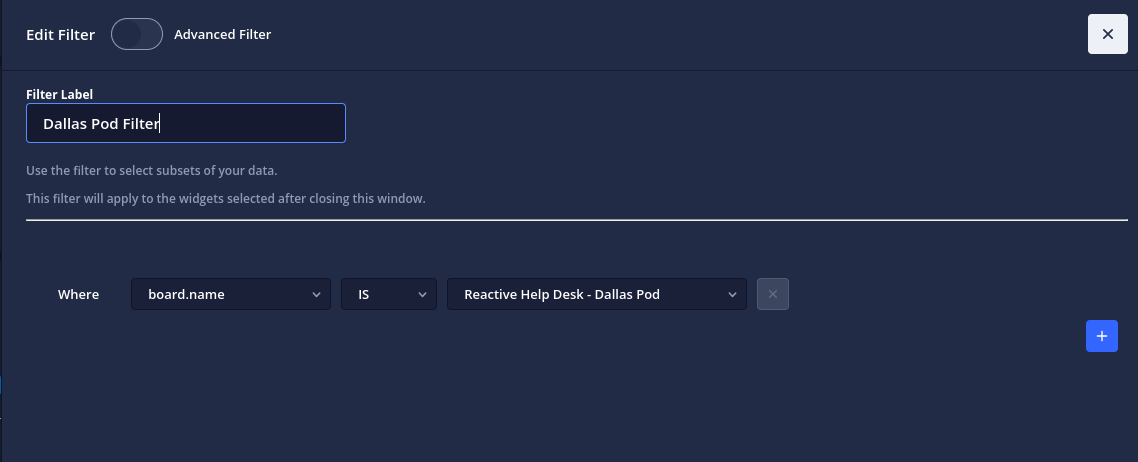
Step 7: Build and Save the Filter
Click the edit button to build the filter. Once you’ve defined your filter parameters, click the close button.
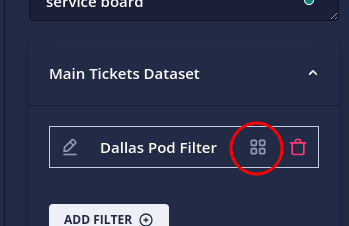
Step 8: Select Widgets
Next, click the “Select Widgets” button. This will put you in a widget-selecting mode. Click on all widgets you want to be filtered by the filter you just created. Some widgets will be greyed out. These widgets aren’t using the data stream that you made the filter for, so they’re disabled.
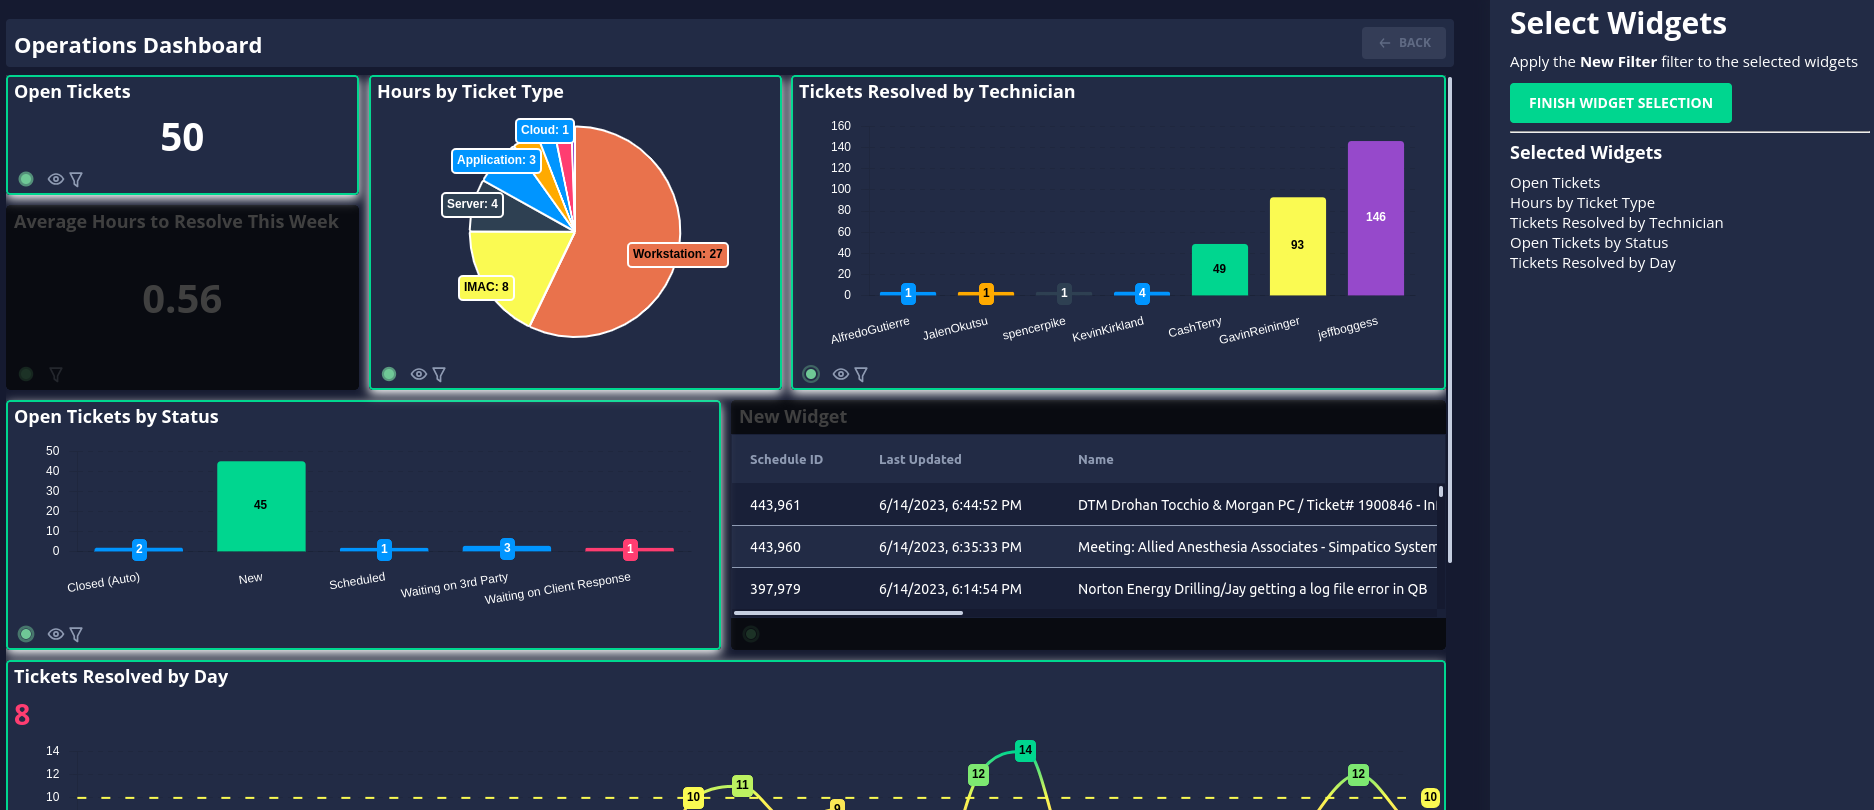
Step 9: Save Your Selection
Once you’ve finished selecting the widgets, click the save button to finalize your selections.
Step 10: Add More Filters and Filter Views
You’re not limited to just one filter or Filter View. Feel free to create as many as you need to make your dashboard as customized and useful as possible.
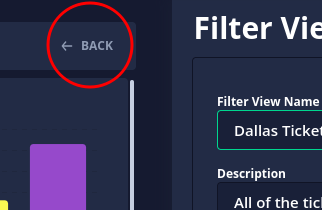
Step 11: Save Your Dashboard
Once you’re done setting up your Filter Views, click back and then save your dashboard. You’ll now see the Filter View in the dropdown in the top right of the dashboard.
Conclusion
And there you have it! You’ve successfully created and applied Filter Views to your dashboard. This powerful feature provides a highly customized data visualization experience, allowing you to filter and view your data exactly how you want to. It’s all part of our commitment to making data analysis as intuitive and effective as possible. Enjoy the power of Filter Views and happy data analyzing!