Features
The data you need, the way you need it.
The true power of our platform is the impact it has on your ability to make effective decisions and run your business with confidence. These are the pieces that make it all happen.

Connect and combine your data.
This is where the magic starts. Sync your data sources and connect them to each other. You can create different configurations using different data from different sources for different reporting needs.
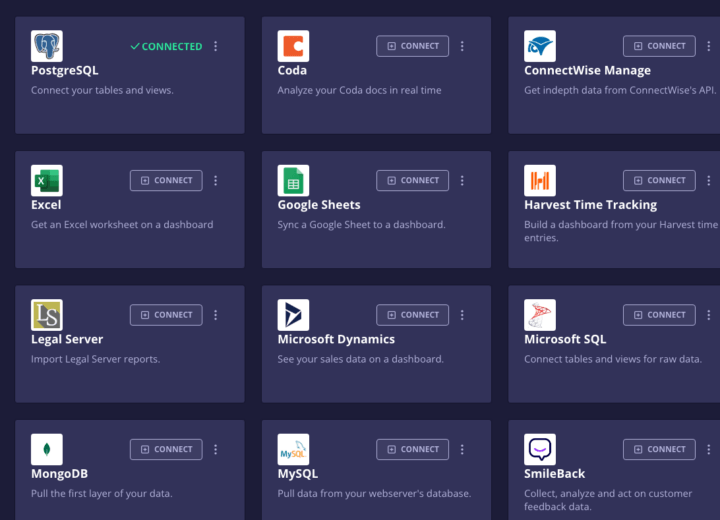
Data Streams
Create clear collections of data from any sources you want, ensuring only what’s needed is passed downstream, keeping your data free of clutter, your information secure, and your dashboards running at top speed.
Datasets
Datasets are the underlying structure that drives visualization and intelligence. Standard datasets take incoming data from a single integration, normalize it, and pass along only what’s needed to the dependent items.
Joined Datasets
Joined datasets combine the incoming data points from multiple integrations and make them interoperable, giving you the power to measure things that previously relied on spreadsheet exports to compare.
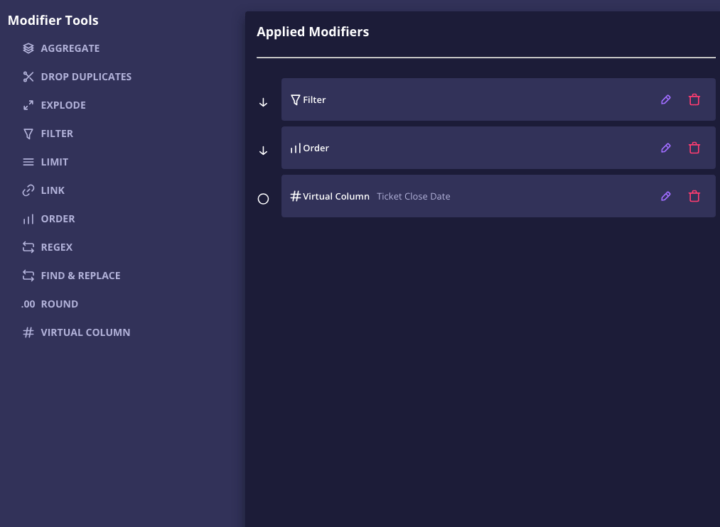
Modified Datasets
Transform data from any incoming source to get the insights you need using powerful Modifier Tools such as aggregation, find & replace, ordering, our proprietary Virtual Columns, and more.
Sync Agents
Optimized processes keep the data across all your integrations synchronized to maintain data integrity and accuracy.
Modify how your data is calculated.
Take control over how your data is used. From as simple as how the source presents it to complex alterations, you’ll be able to get the data you need, the way you need it.
Aggregate
Summarize data across sources and columns.
Drop Duplicates
Eliminate data point duplication.
Explode
Instantly parse strings into usable data points.
Filter
Narrow results by any criteria.
Find & Replace
Automate data replacement with conditions.
Limit
Return a specified number of records.
Link
Link data points for deeper drilldowns.
Order
Simple or complex sorting on any data point.
Regex
Unfettered pattern-based find & replace capability.
Round
Numerical precision with ease.
Virtual Columns
Create new, reportable data points.
Organize based on business needs.
Grouping and extensive filtering options allow you to control exactly what data points are shown where. No more superfluous metrics to ignore.

Advanced Filters
Apply standard and advanced filter criteria to entire dashboards or individual widgets. Use multiple filters to organize dashboards into business intelligence powerhouses.
Dynamic Filter Variables
Create fully custom filter criteria beyond standard comparison operators that can be applied to individual widgets or entire filter views.
Grouping
Visualize insights based on shared values across data points to see commonalities and outliers at a glance. Take those groups to the next level with combined filters and modifiers.
Visualize the right data, right now.
Fully customizable dashboard builder lets you present your data in a variety of different formats, charts, graphs, and widgets. Never wonder about your data integrity again.
Templates
Pre-built dashboards with widgets already configured for common uses across different industries. Simply connect your datasets and you’re up and running in minutes.
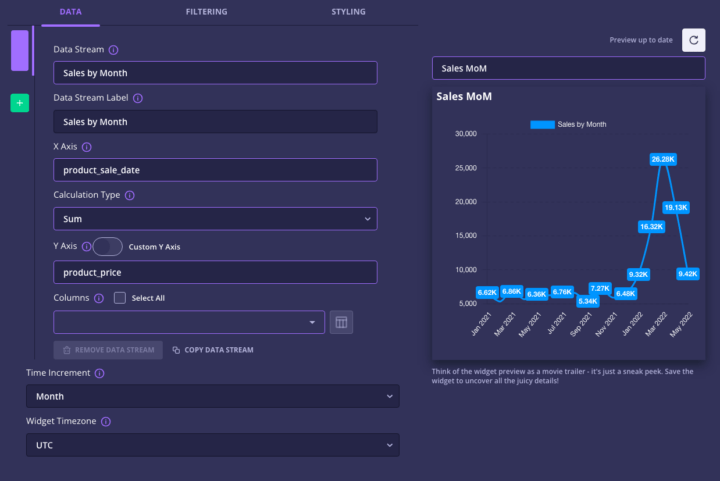
Widgets
The building blocks of Resplendent dashboards. From data-driven charts to full-blown matrix tables, widgets turn underlying data into useful visual representations with built-in, real-time performance indicators.
Filter Views
Quickly switch between pre-filtered dashboard configurations to see data for any business function at a moment’s notice. Seeing relevant data has never been so easy.
Share Links
Create shareable dashboard links for employees or clients so they can stay up-to-date with the data that’s most important to them. Any changes to the master dashboard are instantly reflected on shared views.
API Access
Further streamline your access to intelligence data by embedding Resplendent dashboards in external sites and apps with access and support to our API.
How it works...
Resplendent Data transforms raw data from the tools and apps you're already using into actionable, visual dashboards in a few short steps.
Integrations
These are your apps and databases that contain data waiting to be visualized.


Datasets
Each dataset represents one category of data, such as clients, tasks, tickets, or invoices.
Invoices
Clients
Time Entries
Tickets
Joined Datasets
Joined datasets are created by combining data from two standard datasets.
All Data Combined
Modified Datasets
Modified datasets clean or modify data before visualization, such as replacing text or performing calculations.
Filter internal tickets
Remove duplicate tickets
Standardize ticket types
Widgets
Widgets turn the data from any dataset into a visual representation.
Simple
A basic example of data flowing directly from the source to dashboard widgets.
Integrations
These are your apps and databases that contain data waiting to be visualized.
Datasets
Each dataset represents one category of data, such as clients, tasks, tickets, or invoices.
Invoices
Widgets
Widgets turn the data from any dataset into a visual representation.
Advanced
A robust example of preparing data for even more helpful insights and visualization.
Integrations
These are your apps and databases that contain data waiting to be visualized.
Datasets
Each dataset represents one category of data, such as clients, tasks, tickets, or invoices.
Clients
Time Entries
Tickets
Joined Datasets
Joined datasets are created by combining data from two standard datasets.
All Data Combined
Modified Datasets
Modified datasets clean or modify data before visualization, such as replacing text or performing calculations.
Filter internal tickets
Remove duplicate tickets
Standardize ticket types
Widgets
Widgets turn the data from any dataset into a visual representation.
Ready to see it (and believe it)?
P.S. You can do both and we'll use your own data for the demo.