
Somewhere in your company, right now, the answer to your most expensive question already exists. Not a hunch about it. The actual answer—sitting in a database, a payment record, a support log that nobody thought to open. You have already paid to collect it. You are paying to store it. You are just not using it.
That is the strange plot twist of running a business in 2026. Nobody is short on data anymore. We are swimming in it. The average company now holds more information than it could read in a lifetime, and still makes its biggest calls roughly the way the number two at an ’80s company did from his wood-paneled office: a gut feeling, a couple of figures on a printout, and a quiet hope that whoever is talking loudest in the room happens to be right.
The companies pulling ahead have simply stopped guessing. They have found a way to make the answer walk up and introduce itself, before the meeting instead of after it. And the gap between them and everyone else is not the kind that closes on its own. It is the kind that widens.
Why This Is the Whole Game Now
For years, “be more data-driven” was the kind of advice you nodded along to and quietly ignored. That era is over, and the numbers make the case better than any pep talk. Research from MIT’s Center for Information Systems Research, based on 259 large companies, found that the top “real-time businesses” posted 62 percent higher revenue growth and 97 percent higher profit margins than the laggards. A Forrester study commissioned by Collibra found that companies leaning on data to make decisions were 58 percent more likely to beat their revenue goals. And a Harvard Business Review Analytic Services survey sponsored by Google Cloud found data leaders running circles around their peers on customer loyalty (77 percent versus 45 percent) and operational efficiency (81 percent versus 58 percent).
Here is the twist, though. Most companies know all this and still can’t act on it. The same NewVantage Partners survey (now run by Wavestone) that Forbes covered found only 23.9 percent of organizations describe themselves as genuinely data-driven. Nearly 80 percent blamed culture, people, and process rather than technology. So the raw material is sitting right there, and almost everyone is leaving most of it on the floor. Seagate and IDC put a hard number on that waste in their Rethink Data report: 68 percent of the data available to businesses goes completely unused.
You do not need to overhaul your culture overnight to fix this. You need to notice the warning signs and then give your people a tool that makes clarity the path of least resistance. Here are seven signs it’s time.
Sign One: Your Business Runs on Spreadsheets Held Together by Hope
There is nothing wrong with a spreadsheet. There is a lot wrong with running a growing company on forty of them. When the monthly report is a manual copy-paste ritual, when one person owns “the file” and everyone waits on them, when a single fat-fingered cell can throw off a board deck, you are not analyzing your business. You are babysitting it.
The cost is not just annoyance. Gartner has estimated that poor data quality drains the average organization by roughly $12.9 million a year, and manual spreadsheet workflows are where a lot of that rot starts. A modern BI platform swaps the ritual for a pipeline. Numbers flow in from your source systems, get modeled once, and land on a dashboard everyone trusts. The analyst who used to spend three days a month assembling the report gets those three days back to actually think.
Sign Two: Every Meeting Starts with an Argument About Whose Number Is Right
You know this one. Marketing says the campaign drove 400 leads. Sales counts 260. Finance has a third figure entirely, and the next twenty minutes evaporate into a debate about definitions instead of decisions. When teams pull from different sources with different logic, you don’t have data, you have dueling opinions wearing lab coats.
This is the “single source of truth” problem, and it is exactly why the culture stat above is so stubborn. People don’t resist data because they hate facts; they resist it because they’ve been burned by conflicting facts. A BI platform fixes the argument at the root by defining a metric once, centrally, so “qualified lead” means the same thing in every room. The conversation shifts from “is this right?” to “what do we do about it?” That shift is the entire point.
Sign Three: You’re Drowning in Data but Starving for Insight
More data has not made most companies smarter. It has mostly made them tired. Remember that 68 percent of available data going unleveraged? That is not a storage problem, it is an attention problem. The signal is there. Nobody has time to dig it out.
This is where a good BI layer earns its keep, because its job is not to show you everything, it is to show you what changed and what it means. Netflix is the classic proof point. The company’s leaders have publicly estimated that their recommendation and personalization engine is worth about $1 billion a year in retained subscribers. That value did not come from having more data than everyone else. It came from turning data into a decision at the exact moment a viewer was deciding what to watch. Most businesses have their own version of that moment. The question is whether anything surfaces before it passes.
Sign Four: By the Time the Report Is Ready, the Moment Is Gone
A report that describes last quarter is history homework. Useful, sometimes, but it won’t help you catch the stockout that’s forming right now or the region that’s quietly softening this week. When your reporting cadence is monthly and your market moves daily, you are always steering by the rear-view mirror.
The MIT CISR research is worth repeating here because the gap it measures is enormous: real-time businesses weren’t a little ahead, they were 62 percent and 97 percent ahead on growth and margin. Speed compounds. A modern BI stack collapses the distance between something happening and someone seeing it, so a manager spots the dip on Tuesday instead of reading about it in the month-end deck. You don’t get that agility from a faster spreadsheet. You get it from a system built to refresh and alert on its own.
Sign Five: Only Three People in the Building Can Actually Get an Answer
In a lot of companies, “asking a question of the data” means filing a ticket and waiting a week for a stretched analytics team to get to it. The analysts are brilliant and completely underwater. Everyone else learns to stop asking. That bottleneck is quietly one of the most expensive things in the business, because it means most of your decisions are made on gut feel while the answers sit locked behind a queue.
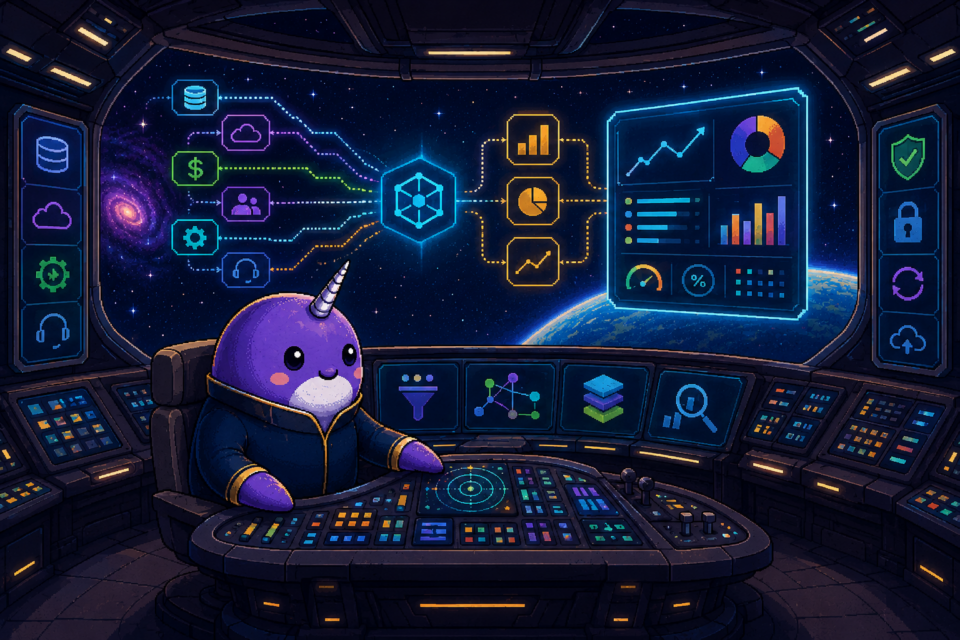
The fix that actually works is self-service, and the HBR Analytic Services survey found 91 percent of leaders now agree that democratizing access to data matters. This is also where Resplendent Data leans hard into something people genuinely enjoy using. Meet Eric, our AI assistant, who happens to be a magical narwhal and is a lot friendlier than a SQL prompt. You ask Eric a question in plain language and he goes looking, surfacing the right dataset or dashboard, drafting a widget for you, and picking up the thread of a conversation you started yesterday because he remembers the context. Under the hood there’s real governance too: company and user memory with version history and rollback, weekly AI credit allowances, usage visibility, and admin controls so a curious sales rep asking Eric a dozen questions never blows up anyone’s budget. You’ll find “Ask AI” tucked in the documentation menu, and the fastest way to understand it is to go ask it something.
Sign Six: You’re Always Reacting, Never Predicting
Descriptive reporting tells you what happened. It’s table stakes. The companies pulling ahead are the ones using their data to see around the corner: which customers are about to churn, which inventory will run thin before the holiday rush, which lead is worth calling today. When your team is permanently in firefighting mode, it’s usually because the data only ever arrives as an autopsy.
That Forrester finding about data-driven firms being 58 percent more likely to beat revenue targets is really a story about anticipation. They hit their numbers because they saw the softness early enough to do something about it. A modern BI platform is where that forward view lives, blending historical trends with the leading indicators that hint at what’s next, so your team can spend less energy explaining the past and more shaping the quarter ahead.
Sign Seven: Your Systems Don’t Talk to Each Other
Your CRM knows one slice of the customer. Your finance tool knows another. Your support desk, your ad platform, your product analytics, your warehouse system, each holds a piece, and none of them share. So you get a fractured picture stitched together by hand, if it gets stitched at all. A Forrester report on data literacy found 41 percent of business leaders describe making data-driven decisions as very or extremely challenging, and disconnected systems are a huge part of why. You can’t reason about a whole you’ve never actually seen.
This is the connective work a BI platform is built for. It pulls those scattered sources into one place, reconciles them, and provides you with the customer, the P&L, and the operation as single coherent views instead of a dozen partial ones. McKinsey’s vision of the data-driven enterprise describes a world where data is woven into every decision and process rather than bolted on afterward. Connected systems are the precondition for that. Everything else is guessing with extra steps.
So, No Pressure, but the Clock Is Ticking
Here’s the friendly version of the hard truth. None of these seven signs is fatal on its own. Plenty of good companies limp along with spreadsheet sprawl and a week-long analytics queue for years. The catch is that your competitors are reading the same research you are, and the ones acting on it are compounding a real advantage every single quarter. The gap between the companies acting on what their data already knows and the ones still guessing doesn’t stay the same size. It widens.
The good news is that closing it has never been less painful. You don’t need a two-year transformation program or a team of PhDs. You need your systems talking, your metrics agreed on, and your people able to ask a question and get an answer before the moment passes.
Not just data, Resplendent Data.
Connect your systems, cut through the noise, and turn complexity into clarity with a magical narwhal named Eric riding shotgun. Watch the demo, or start your free trial and see your own numbers come to life.